
Introduction
Box and whisker plots (also called box plots) are fundamental statistical tools for visualizing and analyzing data distribution. Yet many students find them confusing—unsure how to read them, what the different components mean, or how to answer questions about them.
The reality: box and whisker plots aren’t complicated once you understand what each part represents. The box shows where most data concentrates; the whiskers show the range; the line inside the box is the median. Each component tells a story about your data.
Whether you’re preparing for standardized tests (SAT, ACT, STAAR), completing homework, or simply wanting to understand data visualization better, mastering box and whisker plots is essential. These plots appear throughout statistics, data science, and real-world data analysis.
This comprehensive guide walks you through box and whisker plots step-by-step: what they are, what each component means, how to construct them from data, and how to answer various question types. With practice using the frameworks provided, you’ll confidently solve any box and whisker plot problem.
What Is a Box and Whisker Plot?
Basic Definition
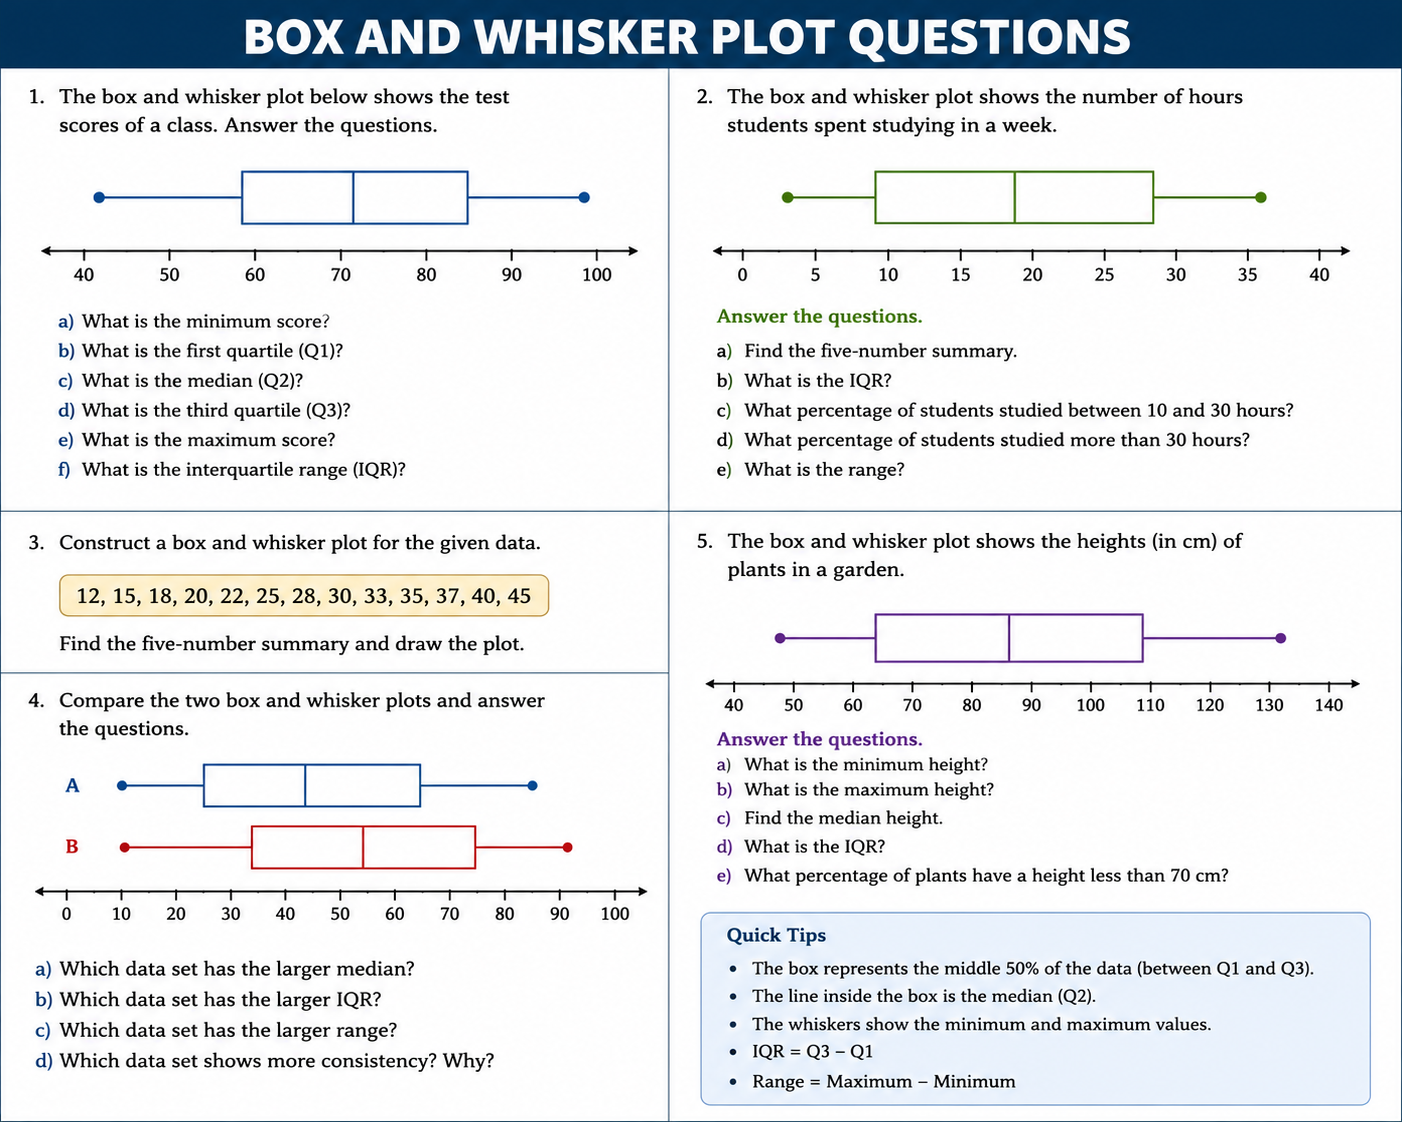
A box and whisker plot is a graphical representation of data distribution showing five key statistics:
- Minimum value
- First quartile (Q1)
- Median (Q2)
- Third quartile (Q3)
- Maximum value
The plot uses a box to display the middle 50% of data and whiskers (lines) extending to show data extremes.
Visual Components
        Whisker                 Whisker
         |-------|              |-------|
Min -----|        |--Box--|---Box--|        |----- Max
         |        |      |      |  |        |
         |        Q1    Q2     Q3  |        |
         |        |      |      |  |        |
         |--------|------|------|--|--------|

         Minimum  Q1   Median  Q3 Maximum
                      (Q2)

         |<----- 25% ----->|<----- 25% ----->|
         |<----- 50% of data (Interquartile Range) ----->|
Key Components Explained
Minimum:
The smallest value in the dataset. One end of the lower whisker.
Q1 (First Quartile):
The value separating the lowest 25% of data from the rest. Left edge of the box.
Median (Q2):
The middle value when data arranged in order. The line inside the box dividing it.
Q3 (Third Quartile):
The value separating the lowest 75% of data (or highest 25%) from the rest. Right edge of the box.
Maximum:
The largest value in the dataset. One end of the upper whisker.
Interquartile Range (IQR):
The range containing the middle 50% of data. Calculated as Q3 – Q1. Represents the width of the box.
What Each Part Shows
The box (from Q1 to Q3):
Contains the middle 50% of data. Shows where data is most concentrated.
The median line (inside the box):
Shows the center of the data. Divides the box into two parts, which may be unequal (showing skewed data).
The whiskers:
Extend from the box to the minimum and maximum values (unless outliers present). Show data spread and range.
Outliers:
Points beyond the whiskers that are unusually far from other data. Shown as individual dots.
Understanding the Five-Number Summary
The foundation of box and whisker plots is the five-number summary. Understanding this is critical for reading and creating plots.
The Five Numbers
- Minimum: Smallest value
- Q1: 25th percentile (25% of data below this point)
- Q2 (Median): 50th percentile (50% of data below this point)
- Q3: 75th percentile (75% of data below this point)
- Maximum: Largest value
What Percentiles Mean
Percentile definition:
A percentile indicates the percentage of data points below a particular value.
Q1 = 25th percentile means:
- 25% of all data values are less than Q1
- 75% of all data values are greater than Q1
Median = 50th percentile means:
- 50% of all data values are less than median
- 50% of all data values are greater than median
Q3 = 75th percentile means:
- 75% of all data values are less than Q3
- 25% of all data values are greater than Q3
Calculating Quartiles: Step-by-Step
Step 1: Order the data from smallest to largest
Example data: 15, 8, 23, 12, 19, 10, 25, 14, 9, 18
Ordered: 8, 9, 10, 12, 14, 15, 18, 19, 23, 25
Step 2: Find the median (Q2)
With 10 values (even), median is average of 5th and 6th values:
- 5th value: 14
- 6th value: 15
- Median: (14 + 15) ÷ 2 = 14.5
With odd number of values, median is the middle value.
Step 3: Find Q1 (median of lower half)
Lower half (values below median): 8, 9, 10, 12, 14
Q1 = middle value = 10
Step 4: Find Q3 (median of upper half)
Upper half (values above median): 15, 18, 19, 23, 25
Q3 = middle value = 19
Step 5: Identify minimum and maximum
Minimum: 8
Maximum: 25
Five-number summary:
- Minimum: 8
- Q1: 10
- Median: 14.5
- Q3: 19
- Maximum: 25
IQR = Q3 – Q1 = 19 – 10 = 9
Identifying and Handling Outliers
What Are Outliers?
Outliers are data points that are unusually far from the rest of the data.
Example:
Dataset: 2, 3, 4, 5, 5, 6, 7, 8, 9, 100
The value 100 is an outlier—much larger than all other values.
Why Identify Outliers?
- They significantly affect data analysis
- Statistical measures (mean) become misleading
- Box plot must show them visually
- May indicate data errors or special cases
Mathematical Definition of Outliers
Outliers are defined using the 1.5 × IQR rule:
Lower fence = Q1 – 1.5 × IQR
Upper fence = Q3 + 1.5 × IQR
Any value below the lower fence or above the upper fence is an outlier.
Example: Identifying Outliers
Data: 5, 7, 8, 9, 10, 11, 12, 14, 15, 45
Step 1: Find five-number summary
- Minimum: 5
- Q1: 8.5
- Median: 10.5
- Q3: 13.5
- Maximum: 45
Step 2: Calculate IQR
IQR = 13.5 – 8.5 = 5
Step 3: Calculate fences
- Lower fence = 8.5 – 1.5(5) = 8.5 – 7.5 = 1
- Upper fence = 13.5 + 1.5(5) = 13.5 + 7.5 = 21
Step 4: Identify outliers
- Is 5 < 1? No
- Is 45 > 21? Yes → 45 is an outlier
The value 45 should be shown as a dot beyond the upper whisker.
Reading Box and Whisker Plots
Extracting the Five-Number Summary
Given a box and whisker plot, identify:
- Minimum: Where the lower whisker ends
- Q1: Where the box begins on left
- Median: Where the line inside the box is
- Q3: Where the box ends on right
- Maximum: Where the upper whisker ends (or highest non-outlier point)
Example: Reading a Plot
Looking at a box plot with axis labeled 0-100:
0----10----20----30----40----50----60----70----80----90---100
              •     |------[_____|_____]------|     •
              |     |             |          |     |
              5    20            45         75    95
           outlier  Q1          Median      Q3   outlier
Five-number summary:
- Minimum (non-outlier): 20
- Q1: 25
- Median: 45
- Q3: 75
- Maximum (non-outlier): 90
- Outliers: 5 and 95
Comparing Two Box Plots
When comparing two datasets:
Position of medians:
- Which median is higher? Which dataset has higher typical values?
Size of boxes:
- Wider box = more spread in middle 50%
- Narrower box = data more concentrated
Length of whiskers:
- Longer whiskers = more extreme values
- Shorter whiskers = less extreme variation
Symmetry:
- Median line in center of box = symmetric data
- Median line off-center = skewed data
- Median closer to Q1 = right-skewed (positive skew)
- Median closer to Q3 = left-skewed (negative skew)
Outliers:
- More outliers = less typical distribution
- Outliers affect mean but not median
Step-by-Step Problem-Solving Framework
Framework for Any Box Plot Question
Step 1: Identify what you’re being asked
- Are you finding five-number summary?
- Comparing datasets?
- Finding specific values?
- Interpreting characteristics?
Step 2: Read the axis carefully
- What are the units?
- What’s the scale?
- Are all tick marks equal distance?
Step 3: Identify the five-number summary
- Mark minimum, Q1, median, Q3, maximum
- Identify any outliers
- Calculate IQR if needed
Step 4: Answer the specific question
- Use the values you identified
- Show calculation if needed
- Write answer clearly
Step 5: Sanity check
- Does answer make sense?
- Are values in correct order? (Min ≤ Q1 ≤ Median ≤ Q3 ≤ Max)
- Is IQR positive?
Common Question Types and Solutions
Type 1: Reading Specific Values from a Plot
Question: “What is the median of this dataset?”
Solution:
- Locate the line inside the box
- Read the value on the axis directly below/above this line
- That’s the median
Example:
If the line inside the box is at 45 on the axis, the median is 45.
Type 2: Comparing Medians Between Two Plots
Question: “Which dataset has the higher median?”
Solution:
- Find the median line in each plot
- Compare positions on the axis
- The higher line indicates higher median
Example:
- Dataset A median at 50
- Dataset B median at 65
- Dataset B has higher median
Type 3: Finding the Interquartile Range
Question: “What is the interquartile range?”
Solution:
- Identify Q3 (right edge of box)
- Identify Q1 (left edge of box)
- Calculate IQR = Q3 – Q1
Example:
- Q1 = 30
- Q3 = 70
- IQR = 70 – 30 = 40
Type 4: Comparing Spreads
Question: “Which dataset has more spread in the middle 50% of data?”
Solution:
- Measure width of box for each dataset
- Wider box = greater IQR = more spread
- Narrower box = smaller IQR = less spread
Example:
- Dataset A box width: 40
- Dataset B box width: 20
- Dataset A has more spread
Type 5: Identifying Skewness
Question: “Is this data distribution symmetric or skewed?”
Solution:
- Find median line inside box
- If median in center: symmetric
- If median closer to Q1: right-skewed
- If median closer to Q3: left-skewed
Example:
If median line is much closer to left edge than right edge, data is right-skewed (positive skew).
Type 6: Comparing Ranges
Question: “Which dataset has a larger range?”
Solution:
- Find minimum and maximum for each dataset
- Calculate range = max – min for each
- Compare ranges
Example:
- Dataset A: min = 10, max = 90, range = 80
- Dataset B: min = 30, max = 70, range = 40
- Dataset A has larger range
Type 7: Outlier Identification
Question: “Are there any outliers in this dataset?”
Solution:
- Find dots beyond the whiskers
- These individual points are outliers
- Count how many
Example:
If dots appear beyond the whiskers, they’re outliers. Count and identify their approximate values.
Type 8: Percentage Questions
Question: “What percentage of data falls between Q1 and Q3?”
Solution:
By definition, Q1 and Q3 define the middle 50% of data.
Answer: 50%
Question: “What percentage of data is less than the median?”
Solution:
By definition, median is 50th percentile.
Answer: 50%
Question: “What percentage of data is greater than Q3?”
Solution:
Q3 is 75th percentile, meaning 75% below it.
Answer: 25% (100% – 75%)
Type 9: Estimating Values
Question: “Approximately what value separates the highest 25% of data?”
Solution:
- The value separating highest 25% is Q3
- Identify Q3 on the plot
- Read the value from axis
Example:
If Q3 is at 80, then approximately 80 separates the highest 25%.
Type 10: Interpretation Questions
Question: “What does the length of the lower whisker tell us about this dataset?”
Solution:
- Lower whisker extends from minimum to Q1
- Length represents spread of lowest 25% of data
- Longer whisker = that quarter of data more spread out
- Shorter whisker = that quarter of data more concentrated
Worked Examples With Complete Solutions
Example 1: Complete Analysis of One Dataset
Given box plot with:
- Minimum: 12
- Q1: 25
- Median: 42
- Q3: 58
- Maximum: 85
Questions:
a) What is the IQR?
b) What percentage of data is between Q1 and Q3?
c) What is the range?
Solutions:
a) IQR = Q3 – Q1 = 58 – 25 = 33
b) By definition, Q1 to Q3 contains middle 50% of data. Answer: 50%
c) Range = Maximum – Minimum = 85 – 12 = 73
Example 2: Comparing Two Datasets
Dataset A:
- Min: 5, Q1: 15, Median: 30, Q3: 45, Max: 60
Dataset B:
- Min: 10, Q1: 20, Median: 35, Q3: 50, Max: 70
Questions:
a) Which has higher median?
b) Which has larger IQR?
c) Which has larger range?
Solutions:
a) Dataset B median (35) > Dataset A median (30)
Dataset B has higher median.
b) IQR_A = 45 – 15 = 30
IQR_B = 50 – 20 = 30
Both have equal IQR.
c) Range_A = 60 – 5 = 55
Range_B = 70 – 10 = 60
Dataset B has larger range.
Example 3: Identifying Outliers
Data: 4, 6, 8, 9, 10, 11, 12, 13, 15, 18, 52
Step 1: Ordered data
4, 6, 8, 9, 10, 11, 12, 13, 15, 18, 52
Step 2: Five-number summary
- Min: 4
- Q1: 8.5
- Median: 11
- Q3: 14
- Max: 52
Step 3: Calculate IQR
IQR = 14 – 8.5 = 5.5
Step 4: Calculate fences
- Lower fence = 8.5 – 1.5(5.5) = 8.5 – 8.25 = 0.25
- Upper fence = 14 + 1.5(5.5) = 14 + 8.25 = 22.25
Step 5: Identify outliers
- Is 4 < 0.25? No
- Is 52 > 22.25? Yes → 52 is an outlier
Common Mistakes and How to Avoid Them
Mistake 1: Confusing Q1 and Q3
Wrong: Thinking Q3 is “upper 25%” instead of “upper-middle boundary”
Correct: Q3 is the value separating lowest 75% from highest 25%
Prevention: Remember: Q1 at 25%, Q3 at 75%
Mistake 2: Assuming Median Is Always in Center of Box
Wrong: Expecting median line always in middle of box
Correct: Median position reflects data distribution. Off-center indicates skewness.
Prevention: Look at actual median position, not where you expect it
Mistake 3: Reading Wrong Endpoints
Wrong: Reading whisker endpoint as quartile value
Correct: Whisker endpoints are minimum/maximum (not Q1/Q3)
Prevention: Remember: Box edges are Q1 and Q3; whisker ends are extremes
Mistake 4: Forgetting About Outliers
Wrong: Assuming whiskers extend to absolute minimum and maximum
Correct: Whiskers may not reach extreme values if outliers present
Prevention: Check for outlier dots beyond whiskers
Mistake 5: Miscalculating Quartiles from Raw Data
Wrong: Not properly ordering data first
Correct: Always order data from smallest to largest before calculating quartiles
Prevention: Write out ordered data, then systematically find middle values
Mistake 6: Confusing Percentage Questions
Wrong: Not remembering standard percentile definitions
Correct: Q1 = 25th percentile (25% below), Median = 50th percentile, Q3 = 75th percentile
Prevention: Write out what each quartile means in percentile terms
Mistake 7: Misinterpreting Whisker Length
Wrong: Thinking longer whisker always means more data points
Correct: Whisker length shows spread; each whisker covers 25% of data
Prevention: Remember: whisker length shows range of 25%, not count
Mistake 8: Assuming All Points Beyond Q3 Are Outliers
Wrong: Thinking all values above Q3 are outliers
Correct: Only values beyond upper fence (Q3 + 1.5×IQR) are outliers
Prevention: Use outlier definition; don’t assume visually
Practice Problems With Solutions
Practice 1: Reading a Box Plot
0----10----20----30----40----50----60----70----80----90---100
                    |----[_____|_____]--------|
                    15   25    40     55       70
Find:
a) Median
b) Q1
c) Q3
d) IQR
e) Range (assuming no outliers beyond whiskers)
Solutions:
a) Median = 40
b) Q1 = 25
c) Q3 = 55
d) IQR = 55 – 25 = 30
e) Range = 70 – 15 = 55
Practice 2: Comparing Datasets
Dataset A: Min=10, Q1=20, Med=35, Q3=50, Max=80
Dataset B: Min=5, Q1=15, Med=40, Q3=65, Max=95
Questions:
- Which has higher median?
- Which has larger IQR?
- Which is more spread out overall?
Solutions:
- Dataset B (40 > 35)
- Dataset B (50 vs. 50… wait, let me recalculate)
- IQR_A = 50 – 20 = 30
- IQR_B = 65 – 15 = 50
- Dataset B larger IQR
- Dataset B (larger range: 90 vs. 70, larger IQR)
Practice 3: Finding Outliers
Data: 12, 14, 16, 18, 20, 22, 24, 26, 28, 30, 75
Find outliers using 1.5 × IQR rule
Solution:
- Order: Already ordered
- Five-number summary:
- Min: 12
- Q1: 16 (median of lower half: 12, 14, 16, 18, 20)
- Median: 22
- Q3: 28 (median of upper half: 24, 26, 28, 30, 75)
- Max: 75
- IQR = 28 – 16 = 12
- Fences:
- Lower: 16 – 1.5(12) = 16 – 18 = -2
- Upper: 28 + 1.5(12) = 28 + 18 = 46
- Check: Is 75 > 46? Yes, 75 is an outlier
FAQ: Box and Whisker Plots
Q1: What does the box represent?
A: The box represents the middle 50% of the data (from Q1 to Q3). It contains the interquartile range.
Q2: Why is the median line sometimes off-center in the box?
A: Off-center median indicates skewed data. If closer to left edge, data is right-skewed. If closer to right edge, data is left-skewed.
Q3: What’s the difference between range and interquartile range?
A: Range = max – min (shows all data spread). IQR = Q3 – Q1 (shows middle 50% spread). IQR less affected by outliers.
Q4: How do you calculate quartiles from raw data?
A: Order data, find median (dividing line), then find medians of upper and lower halves. These are Q1 and Q3.
Q5: Can there be more than one outlier?
A: Yes, any data point beyond the fences (Q1 – 1.5×IQR or Q3 + 1.5×IQR) is an outlier. Multiple outliers possible.
Q6: What does a very wide box mean?
A: Wide box means large IQR, indicating middle 50% of data spread out across broad range.
Q7: What if there are no whiskers?
A: Whiskers only extend to minimum/maximum (if not outliers). If Q1 equals minimum or Q3 equals maximum, there’s no whisker on that side.
Q8: How do quartiles relate to percentiles?
A: Q1 = 25th percentile, Median = 50th percentile, Q3 = 75th percentile. They divide data into four 25% groups.
Conclusion
Box and whisker plots are powerful tools for visualizing and analyzing data distribution. Once you understand what each component represents—the five-number summary, quartiles, range, and IQR—interpreting and creating plots becomes straightforward.
Key concepts to remember:
- Five-number summary: Minimum, Q1, Median, Q3, Maximum are the foundation
- Quartiles divide data: Q1 at 25%, Median at 50%, Q3 at 75%
- IQR shows spread: Larger IQR means middle 50% more spread out
- Outliers are special: Use 1.5 × IQR rule to identify points far from main data
- Position matters: Median location indicates skewness
- Compare plots effectively: Look at position (median), spread (IQR), and range
The step-by-step process works:
- Identify what you’re asked
- Extract five-number summary
- Calculate needed values
- Answer the question
- Check your work
With practice using the frameworks and examples provided, you’ll develop intuition for box plot problems. Start with reading existing plots, progress to creating plots from data, then tackle complex comparison and analysis questions. Mastery comes through consistent practice and application of these systematic approaches.
Box and whisker plots will appear throughout your math, science, and data analysis courses. The skills you develop now transfer to more advanced statistical analysis. Invest in understanding them thoroughly, and you’ll have tools valuable for years to come.
